|
Appendix No. 3 - from Women Faculty at the Hebrew University, January 2003, Unit for Planning and Development, HUJI
Hiring Age and Promotion Characteristics of the Senior Academic Faculty - Gender Differences
The expected percentage of women depends, among other things, on the number of years spent at each rank. The differences between men and women in the promotion pace were examined in the following ways:
a. by examining the differences in the empirical rank distribution of men and women;
b. by comparing the estimates of the number of years spent by men and women at the different ranks, based on the promotions committees data between the years 1998-2002;
a. Rank Distribution of Academic Faculty
In a steady state situation the number of years spent at each rank determines the percentage of faculty at each rank. The following charts describe the empirical distribution by rank and the steady state distribution, under the following assumptions: number of years spent at the rank of: Lecturer - 5 years; Senior Lecturer - 6 years; Associate Professor - 7 years; Full Professor - 14 years.
Senior Academic Faculty 2002-2003: Empirical and Theoretical Distributions by Rank
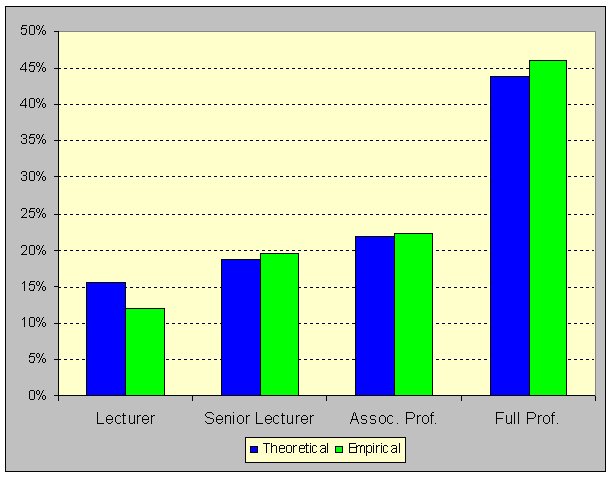
As it may be seen, the empirical distribution of the faculty is very close to the steady state distribution at all the ranks, except at the rank of Lecturer. The percentage of faculty at the rank of Lecturer is lower than it is expected, probably following the cutting down in the number of positions in recent years.
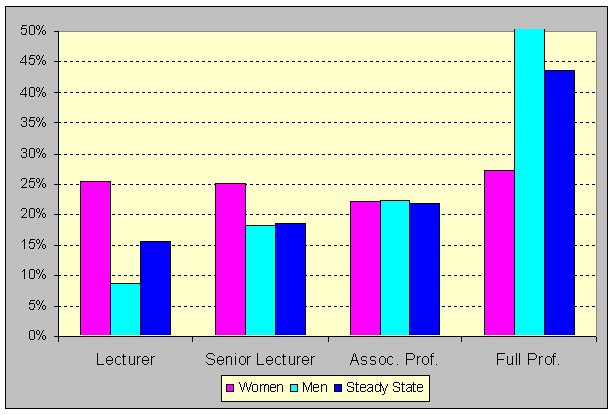
Whereas the empirical distribution of the faculty is close to the steady state distribution, the distribution of women by rank is clearly different from that of men. The difference in the percentage of men and women at the rank of Lecturer stems from the increase in the percentage of women at the hiring stage in recent years and the decrease in the percentage of men, accordingly. Another possible factor contributing to the percentage of men at the rank of Lecturer being lower than the theoretical percentage, might be that a greater number of men is hired directly at the rank of Senior Lecturer. Therefore, the difference in the percentages of men and women does not indicate a different length of time spent at this rank.
The empirical distributions of men and women indicating the number of years spent at the ranks of Senior Lecturer and Associate Professor are shown in the following table.
The average length of time spent at the rank of Lecturer was established according to the conventional length of time spent at this rank at the Hebrew University, i.e. five years, both for men and women. The number of years spent at the rank of Full Professor was derived from the total number of years spent at the University, which was taken to be 33 years for men and 32 years for women respectively.
| |
Lecturer | Senior
Lecturer | Associate
Professor | Full
Professor | Total | | Women | 5.0 | 8.1 | 7.1 | 11.8 | 32.0 | | Men | 5.0 | 6.0 | 7.4 | 14.6 | 33.0 | | Average | 5.0 | 6.0 | 7.0 | 14.0 | 32.0 |
From this data we infer that women spend approx. two years more than men at the rank of Senior Lecturer whereas at the rank of Associate Professor they spend slightly less time than men do. The low percentage of women at the rank of Full Professor is partly the result of a lengthier period spent at the rank of Senior Lecturer and partly the result of the difference in age at the hiring stage. Since women tend to be hired at an older age (between one to two years difference) and spend more time at the rank of Senior Lecturer, and the total number of years spent at all ranks is known (derived from the difference between the average age at the hiring stage and the age at retirement) women spend less time at the last rank.
b. Number of Years Spent at the Different Ranks and Promotion Characteristics
According to Gender
Our estimates were based on data taken from promotion committees between the years 1998-2002. We learnt that 90% of the cases discussed in the promotion committees end positively without any gender bias. In the population that we examined, we found a two- year difference at the hiring age at the rank of Lecturer - women being older then men .
The total number of years spent at the ranks of Lecturer, Senior Lecturer and Associate Professor is approx. 19 years, for men and women equally. There is no difference between men and women in the number of years spent at the rank of Lecturer, whereas women spend one year more at the rank of Senior Lecturer and one year less at the rank of Associate Professor. In the population examined we do not expect to find a difference in the number of years spent at the rank of Full Professor since there was no difference between men's and women's average age in the promotion to Full Professor.
Yet findings obtained a few years ago showed that women spent up to four years less at the rank of Full Professor, thus reducing their percentage at this rank
c. Summary
In view of the differences in the empirical distributions of men and women and based on the findings described above, it may be concluded that:
* The difference in the percentage of men and women at the rank of Lecturer stems mainly from the difference at the hiring stage. There is no indication of a meaningful difference in the length of time spent at this rank.
* Women spend more time at the rank of Senior Lecturer. The estimate of the number of years spent at this rank and the empirical distribution of the faculty support this. Yet, in the past there used to be a greater difference in the number of years women spent at the rank of Senior Lecturer, which increased the percentage of women at this rank, exceeding even their percentage at the rank of Lecturer. The current data show a decrease in the number of years women spend at this rank and a narrowing of the imparity between men and women.
* From the empirical distribution it may be seen that the percentage of men and women at the rank of Associate Professor is almost identical. Yet, from the population promoted to Full Professor in the last five years, there is an indication that women spend fewer years at the rank of Associate Professor. If this phenomenon continues, we can expect also a decrease in the percentage of women at this rank and, consequently, an increase in the percentage of women at the rank of Full Professor.
* The promotion committees data indicate a gender equality in the number of years spent at the rank of Full Professor, therefore an equal percentage of women at this rank is to be expected. And yet, previous findings indicated that women spend approx. 4-5 years less at this rank. The empirical distribution,- 27% of the women and- 51% of the men - also indicates that women spend less time at this rank. The gap in these percentages stems mainly from three factors, all of which lead to a decrease in the percentage of women at the rank of Full Professor: women tend to be older at the hiring stage, women spend more years at the previous ranks and here has been an increase in the percentage of women hired in the academic faculty.
In sum, in the absence of evidence indicating major gender differences in the promotion procedures, and relatively minor differences in the number of years spent at the ranks of Lecturer, Senior Lecturer and Associate Professor, we may conclude that the main factor explaining the low percentage of women in the academic faculty at these ranks, is the percentage of women Ph.D. graduates in the past. All the other differences influence mainly the low percentage of women at the rank of Full Professor.
|
|